Product features – what they do and how they help your business

This guide describes each product-related feature in simple language. No technical knowledge required.

1

Products and services

Products and services

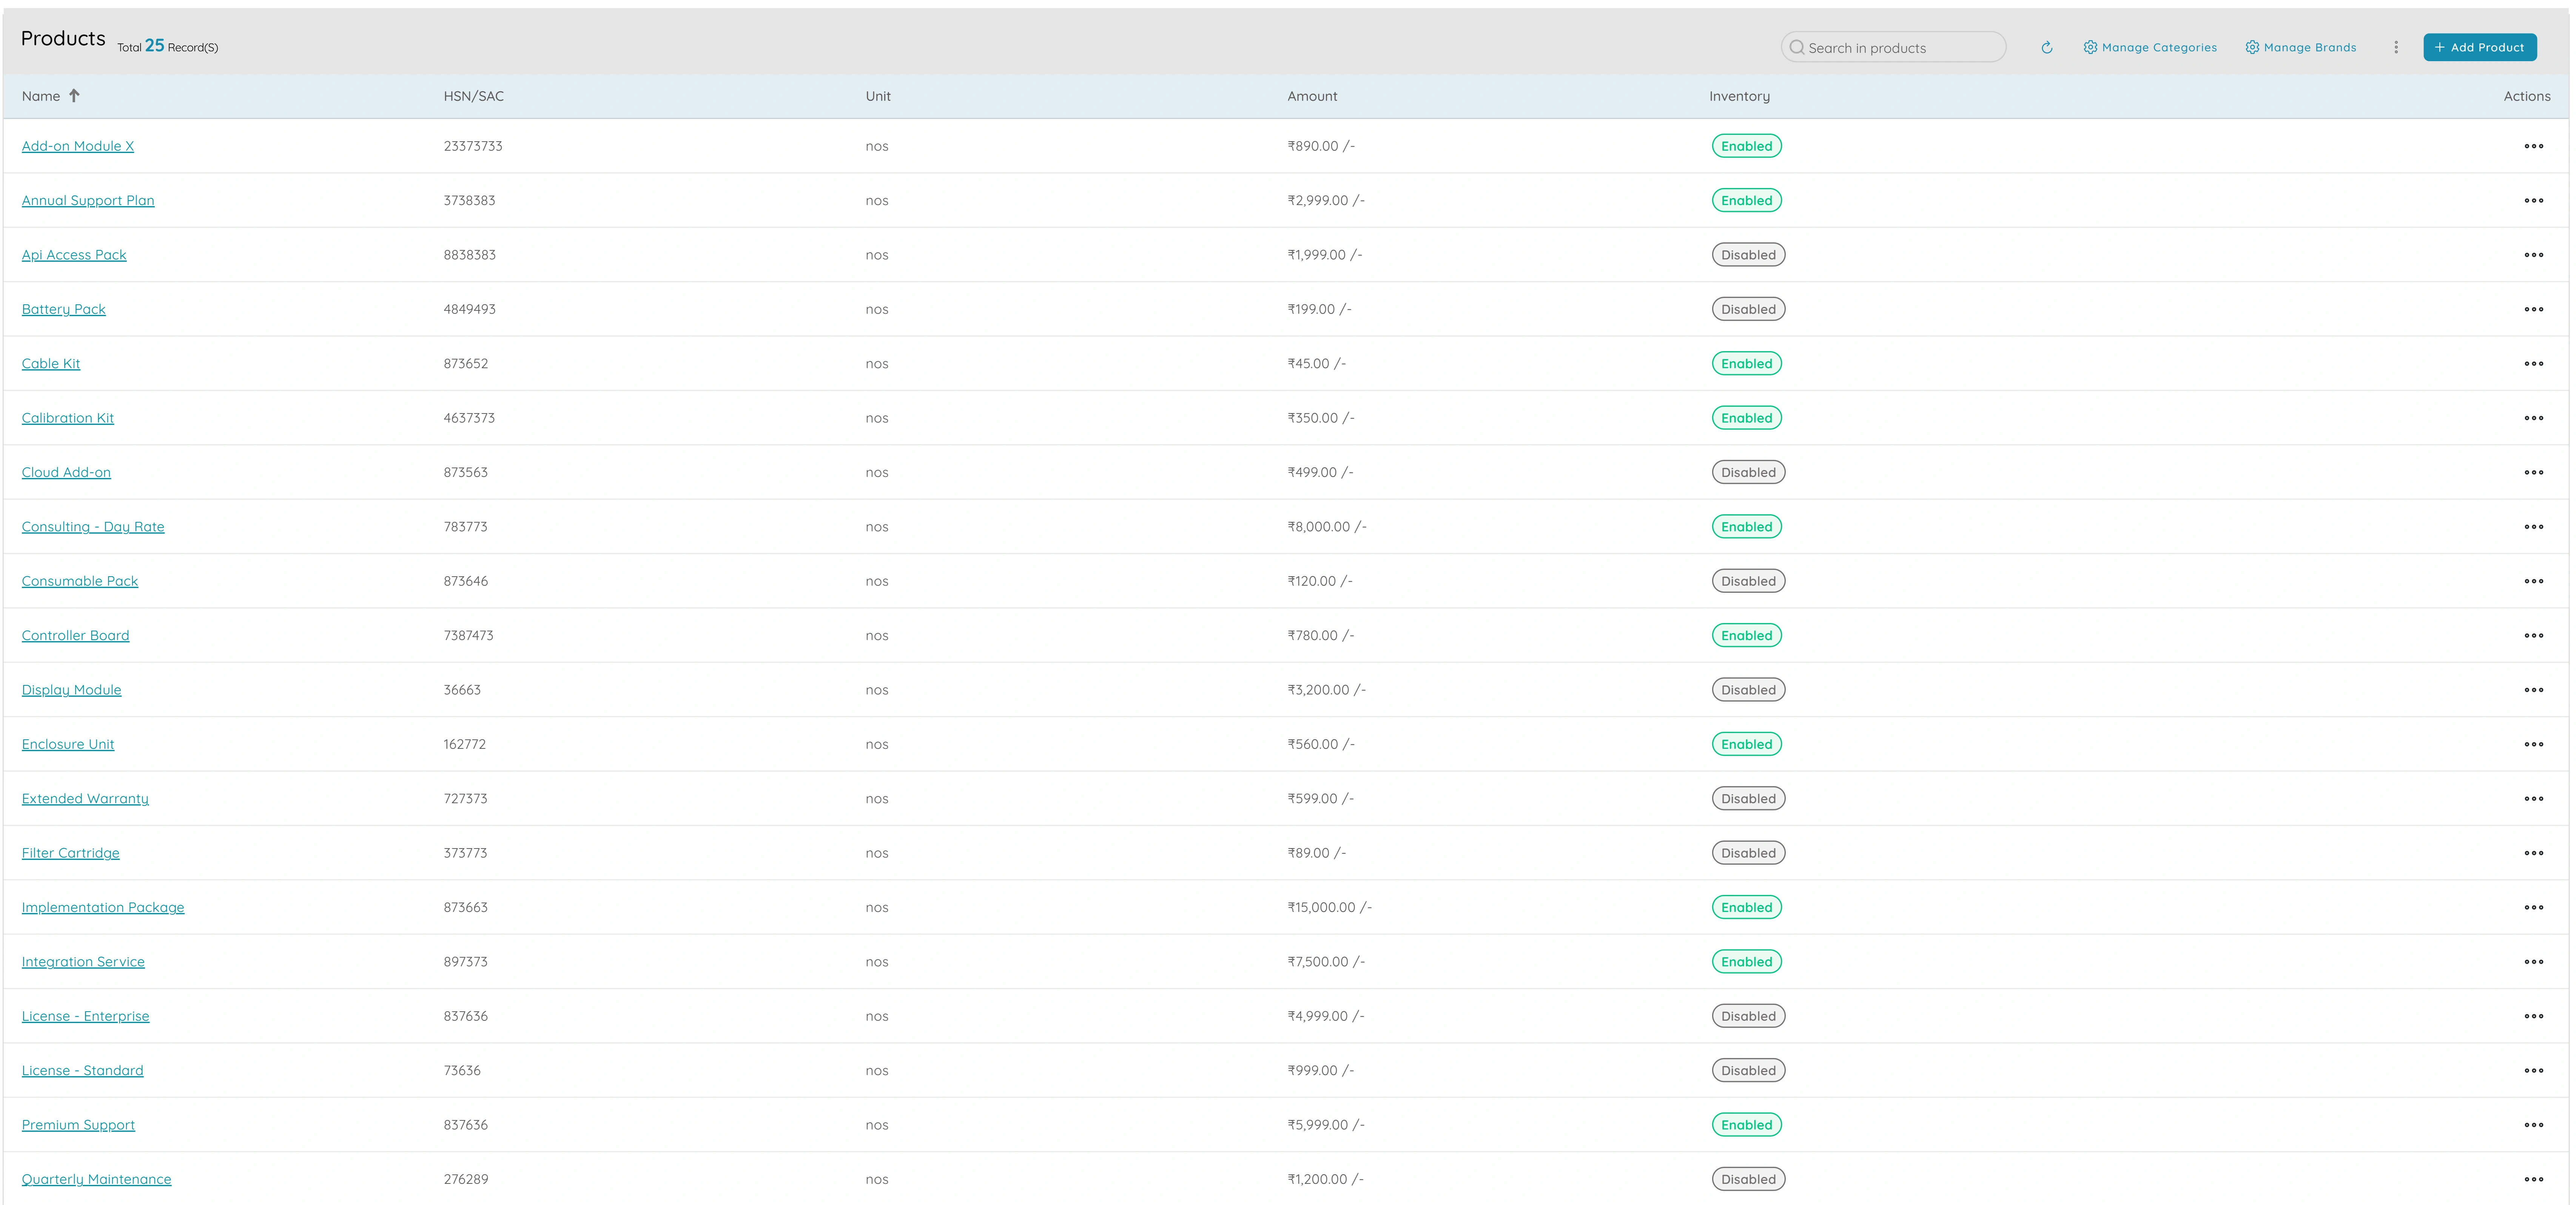
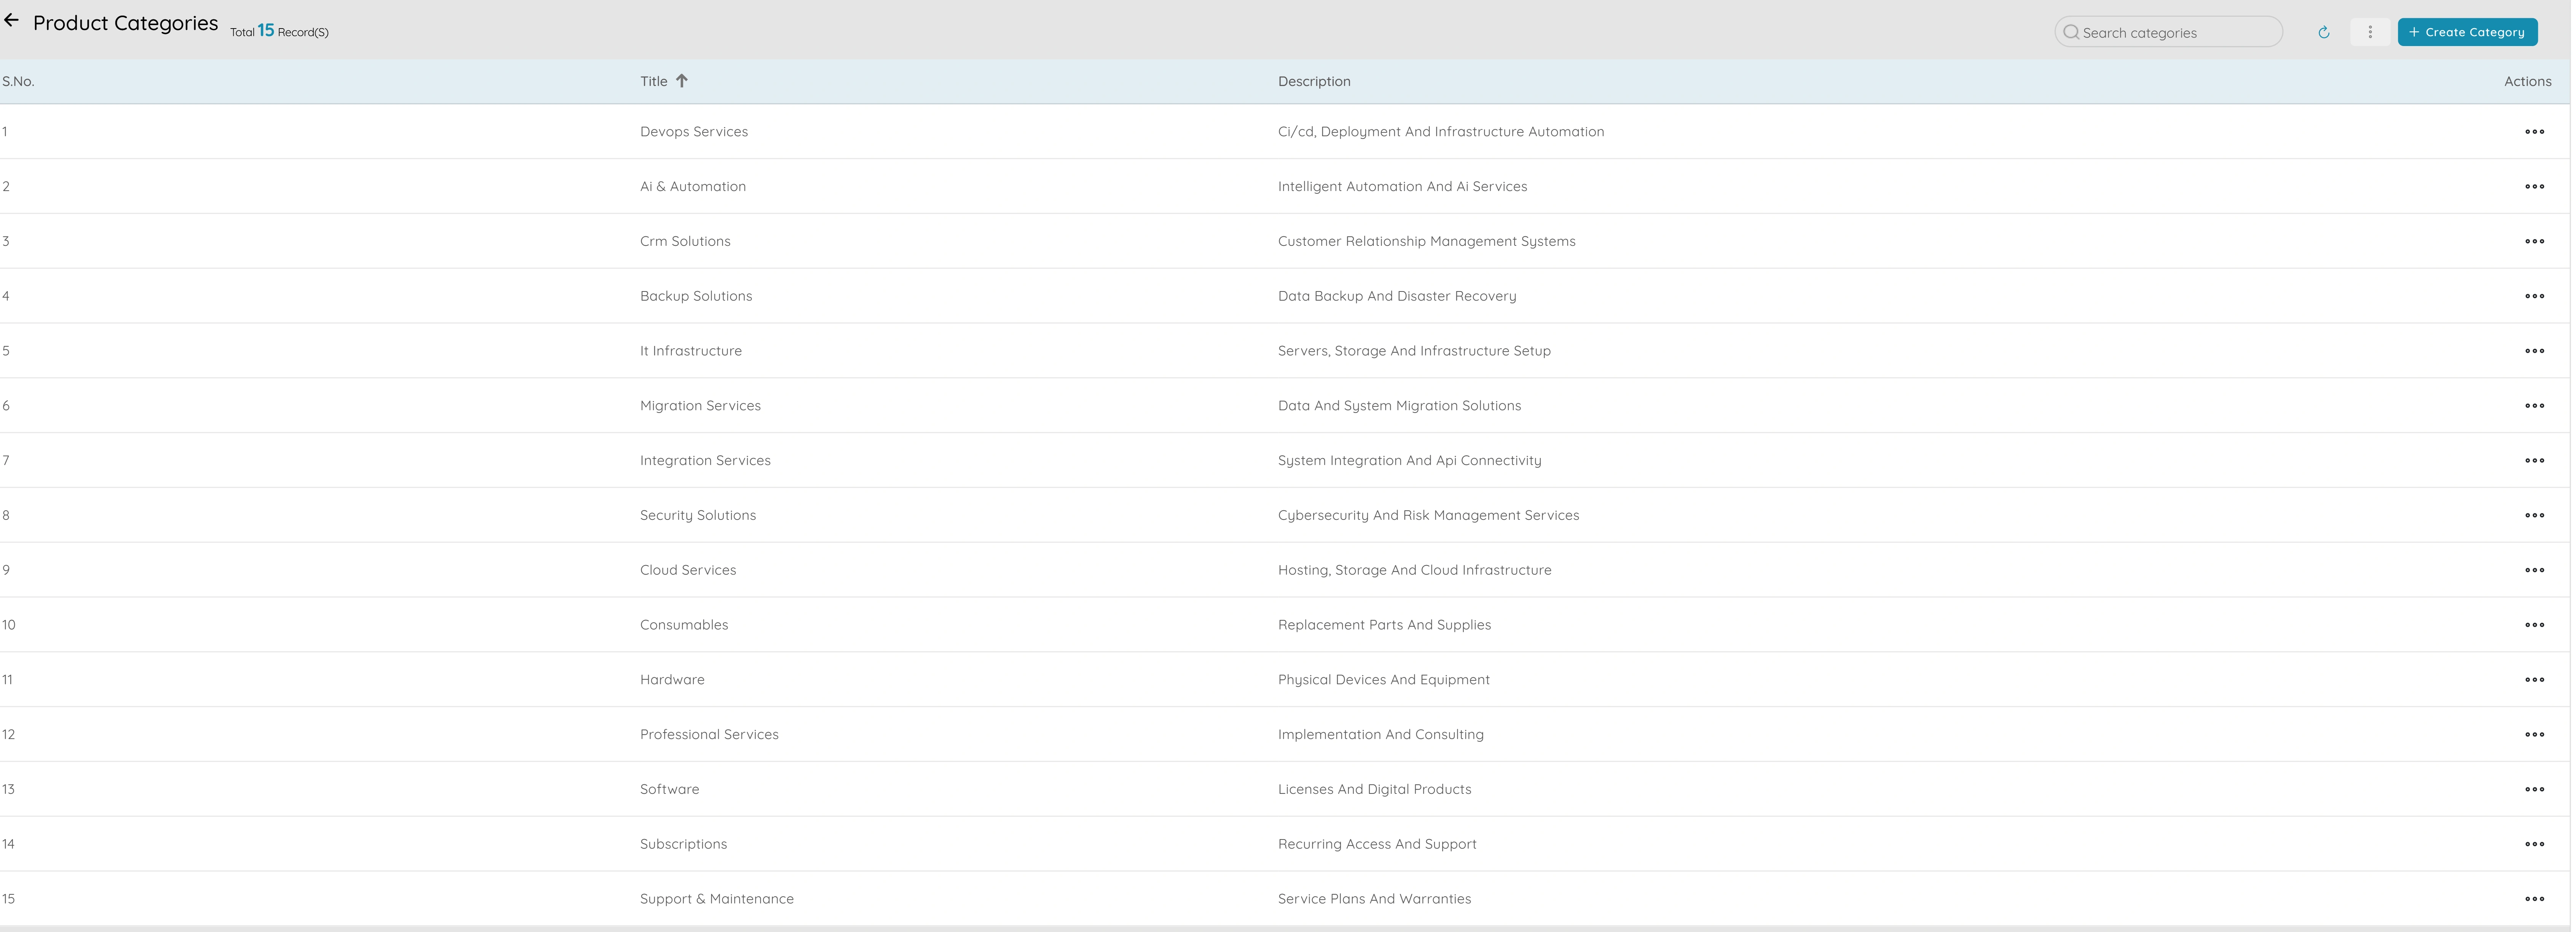
Products and services give you a single catalogue with names, categories, and pricing so everything you sell is defined in one place. Instead of typing product names and prices from memory or from different spreadsheets, you create one record per product or service with name, description, unit (for example piece, hour, or kilogram), price, and tax treatment. When you add a line item to a proposal, order, or invoice, you pick from the catalogue so the same product always appears with the same name and price. That reduces errors and keeps your sales and finance teams aligned on what you offer and how it is described. You can organise products into categories so you can filter the catalogue and run reports by product type or service line. When you change a price or description, you can choose whether to update only new documents or leave existing ones as they were. Having a single catalogue makes it easier to onboard new staff, introduce new products, and keep your offering consistent across channels. Products and services become the single source of truth for your catalogue so that proposals, orders, invoices, and reports all use the same SKUs or service lines and the same pricing.

2

Product categories

Product categories

Product categories let you group SKUs or service lines for reporting and for how you run your business. You create categories (for example Hardware, Software, Consulting, or Maintenance) and assign each product or service to one or more categories. That way when you run reports or look at your catalogue, you can filter and summarise by category instead of scrolling through a long flat list. Categories help you see which lines are selling, which are slow, and how volume and revenue break down by type. You can use categories in reports such as sales by product category so you can answer questions like "how much did we sell in Software this quarter?" or "which category drives the most revenue?" Product categories also make it easier to set up pricing rules, discounts, or tax treatment by type if different categories have different rules. Having a clear category structure supports planning (which lines to push), operations (which lines need stock or capacity), and finance (revenue and cost by line). Product categories turn a long list of SKUs or services into a structured view that supports better decisions and clearer reporting. You can add or change categories as your range evolves so the structure grows with your business.

3

Reports

Reports - 1
Reports - 2

Reports let you see volume and revenue by product and by product category so you can understand which lines perform and plan accordingly. Sales by product shows revenue and quantity sold per SKU or service so you can identify best sellers, slow movers, and trends over time. Sales by product category shows the same for each category so you can see which types of products or services drive the most volume and revenue. You can filter by date range, category, or product and export for presentations or planning. When you use these reports together, you can answer questions like "which products grew this quarter?" or "how does category A compare to category B?" so you can focus on the right lines, adjust stock or capacity, and set targets. Having these reports in one place, with consistent filters and the ability to export, means you spend less time pulling numbers from different systems and more time interpreting them. They become the evidence you need for product reviews, range decisions, and margin analysis. Reports by product and by product category turn your sales data into a clear view of what you sell and how it performs so you can run your product business with data, not guesswork.

4

Projects and tasks

Projects and tasks - 1
Projects and tasks - 2

Projects and tasks let you track delivery and capacity for product-based projects so you know what is being worked on and who is doing what. You create a project for a customer delivery, a launch, or an internal initiative and break it down into tasks with assignees and due dates. That way you can see progress at a glance, spot bottlenecks, and plan capacity. You can link tasks to products or services if the project is about delivering specific lines, so you have one place that says "this project is for product X" or "this task is delivering service Y." Projects and tasks help you balance workload across the team, see what is overdue, and report on how much time or effort went into a product or category. When you run product-based projects—for example custom builds, implementations, or support packages—having projects and tasks in one system means delivery and product stay connected. You can use the same system for internal projects (for example new product development) so capacity and delivery are visible in one place. Projects and tasks become the place where product meets execution: you see what was sold, what is being delivered, and whether you have the capacity to take on more.

5

Chart of accounts and account ledger

Chart of accounts and account ledger

Chart of accounts and account ledger let you trace cost and revenue by account or category so every transaction is coded correctly and you can see where money flows. The chart of accounts is the list of accounts you use for booking revenue, cost, assets, and liabilities; you structure it so that product-related revenue and cost sit in accounts that you can tag or report by product or category. The account ledger is the transaction-level view: every sale, purchase, or adjustment is recorded against an account so you have a full history. When you need to answer "what cost went through this account?" or "what revenue did we book for this product?" you filter the ledger by account or by the tags you use for product and category. That supports auditing, reconciliation, and accurate P&L and EBITDA by product. Having a clear chart of accounts and a reliable ledger means your product-level reports are built on correct data. Chart of accounts and account ledger become the foundation for tracing cost and revenue by product or category so that your product profitability view is accurate and auditable. When you run P&L or EBITDA by product, the numbers come from the same ledger so finance and product teams use one source of truth.

6

Orders

Orders

Orders let you link customer orders to products for fulfilment and revenue recognition so you have one place that says "this order is for these products" and "this is the status." When a customer places an order, you record it with line items from your product catalogue so each order shows exactly which products or services were sold, in what quantity, and at what price. That supports fulfilment (what to deliver or schedule), invoicing (what to bill), and revenue recognition (when to book the sale). You can track order status—for example confirmed, in progress, or fulfilled—so your team and the customer know where things stand. Linking orders to products means your sales-by-product and sales-by-category reports are fed by real orders, so the numbers you see are what customers actually bought. When you need to report on product performance or plan stock and capacity, orders are the source of truth for what was sold and what is in the pipeline. Orders become the link between your product catalogue and the real world: what you sell, what was ordered, and what has been delivered and billed. Having orders linked to products in one system means fulfilment, invoicing, and product reports all use the same data so nothing is missed or double-counted.

Ready to get started?

See how these product features can help your business grow.